Mapping social attitudes towards climate change
Microsimulation tools for social mapping involve the creation of maps that illustrate the geographical distribution of simulated social attitudes within specific territories. These maps are generated using spatial microsimulation, a method that integrates social survey data with local information sources. The data utilized encompass socio-economic and demographic characteristics (e.g., age, education, employment) as well as social attitudes, at various geographical levels of interest.
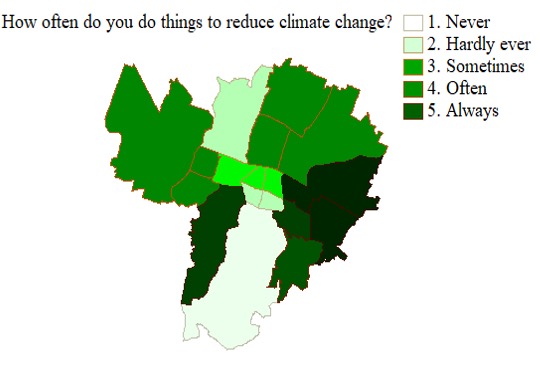
Social mapping spatial microsimulations can be utilized to spotlight spatial patterns of variables related to the European Green Deal and contribute valuable insights to pertinent discussions. The maps below provide an example of simulated social attitudes towards climate change, showcasing variations among different areas within Bologna, Italy (a PHOENIX pilot location). Such maps serve as effective dialogue tools to aid in the formulation of policies for democratic innovations tailored to the specific characteristics of the locality.


What are its key features?
Social mapping microsimulation integrates a diverse range of data sources into a comprehensive, precise, and informative dataset at the individual level.
This facilitates the analysis of social attitudes in conjunction with other individual attributes, such as age group, education level, or income, providing valuable insights for discussions on policy impact.
Social mapping microsimulation allows users to access information (datasets and maps) revealing key climate change attitudes specific to their locality.
What can it be used for?
Social mapping microsimulation can be employed in at least four ways:
- Obtain and further analyze datasets on population characteristics and climate change attitudes;
- Generate intuitive maps illustrating climate change attitudes for specific territories;
- Enhance policy development and impact at the local level;
- Facilitate dialogue among researchers, policymakers, stakeholders, educators, and citizens.
Who can benefit from it?
This innovative tool caters to a diverse audience, including researchers, policymakers, and individuals eager to delve into the connections between individual attributes (such as age group, education level, or income), climate change attitudes, and regional dynamics.
These rich information sources offer a valuable resource for informed decision-making, strategic policy development, and fostering comprehensive discussions on the nuanced interplay between societal characteristics and environmental perspectives.
How has it been used by PHOENIX?
As part of the PHOENIX project, spatial microsimulation has primarily been utilized to depict European citizens’ sentiments regarding issues related to climate change and the European Green Deal. Currently, several pilots have employed the tool to support internal dialogue and facilitate policy development within the pilots’ Democratic Innovation.
Additionally, the tool serves as the foundation for another PHOENIX tool, namely, social simulation tools for participatory behavior; a tool fostering a deeper understanding of critical factors influencing citizens’ willingness to participate in Democratic Innovation addressing issues connected to the European Green Deal.
Contact our partner to learn more!
For more information about this tool please contact
The University of Groningen.
Prof. Dimitris Ballas d.ballas@rug.nl
Dr. Loes Bouman l.bouman@rug.nl
Follow us on: